Ergebnis zur Bundestagswahl 2017 am 24.09.2017
Wahlkreis Schwandorf - Landkreis Schwandorf - Große Kreisstadt Schwandorf
 Diagramm
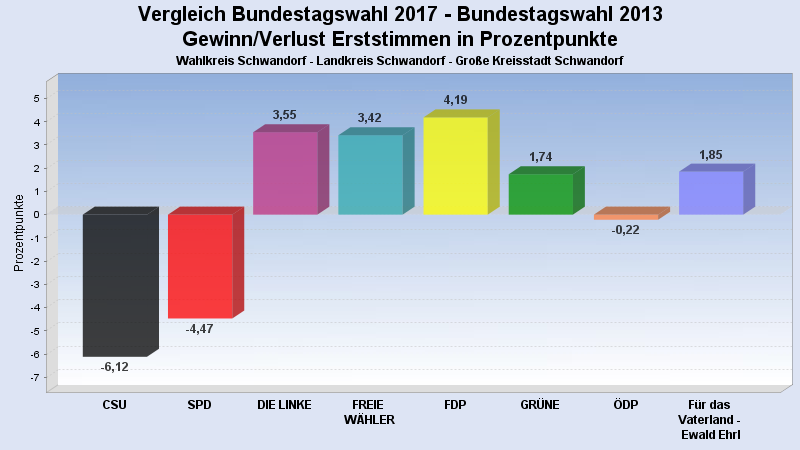
 Seitenanfang
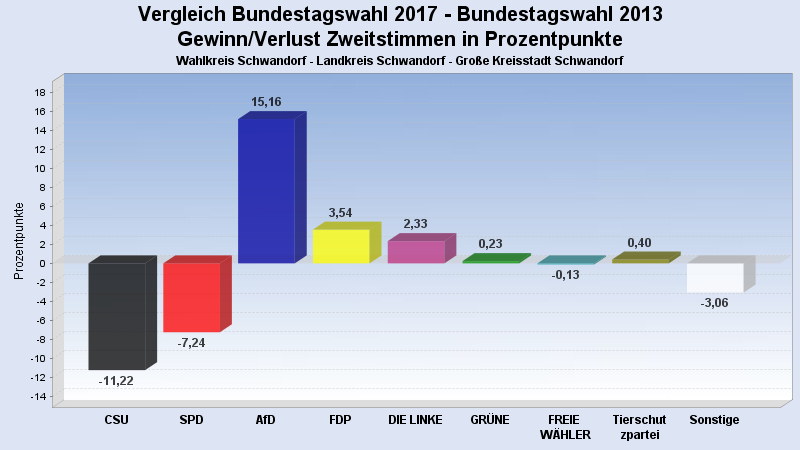
Wahlbeteiligung, Stimmzettel, Stimmen
| 2017 | 2013 | |
|---|---|---|
| Wahlbeteiligung: | 73,10% | 62,90% |
| Wahlberechtigte: | 21.752 | 22.030 |
| Wähler: | 15.900 | 13.856 |
| Ungültige Erststimmen: | 457 | 146 |
| Gültige Erststimmen: | 15.443 | 13.710 |
| Ungültige Zweitstimmen: | 133 | 127 |
| Gültige Zweitstimmen: | 15.767 | 13.729 |
Erststimmen nach Wahlvorschlag
| Partei | Erststimmen 2017 | Prozent 2017 | Erststimmen 2013 | Prozent 2013 | |
|---|---|---|---|---|---|
| 1 | CSU | 6.620 | 42,87% | 6.716 | 48,99% |
| 2 | SPD | 4.478 | 29,00% | 4.589 | 33,47% |
| 6 | DIE LINKE | 1.061 | 6,87% | 455 | 3,32% |
| 7 | FREIE WÄHLER | 1.032 | 6,68% | 447 | 3,26% |
| 4 | FDP | 818 | 5,30% | 152 | 1,11% |
| 3 | GRÜNE | 742 | 4,80% | 420 | 3,06% |
| 9 | ÖDP | 406 | 2,63% | 391 | 2,85% |
| 22 | Für das Vaterland - Ewald Ehrl | 286 | 1,85% | 0 | 0,00% |
Zweitstimmen nach Wahlvorschlag
| Partei | Zweitstimmen 2017 | Prozent 2017 | Zweitstimmen 2013 | Prozent 2013 | |
|---|---|---|---|---|---|
| 1 | CSU | 5.831 | 36,98% | 6.618 | 48,20% |
| 2 | SPD | 3.153 | 20,00% | 3.740 | 27,24% |
| 5 | AfD | 3.011 | 19,10% | 541 | 3,94% |
| 4 | FDP | 1.019 | 6,46% | 401 | 2,92% |
| 6 | DIE LINKE | 927 | 5,88% | 487 | 3,55% |
| 3 | GRÜNE | 700 | 4,44% | 578 | 4,21% |
| 7 | FREIE WÄHLER | 404 | 2,56% | 370 | 2,70% |
| 12 | Tierschutzpartei | 163 | 1,03% | 87 | 0,63% |
| 9 | ÖDP | 146 | 0,93% | 161 | 1,17% |
| 10 | BP | 134 | 0,85% | 226 | 1,65% |
| 19 | Die PARTEI | 65 | 0,41% | 0 | 0,00% |
| 8 | PIRATEN | 64 | 0,41% | 248 | 1,81% |
| 11 | NPD | 51 | 0,32% | 176 | 1,28% |
| 21 | V-Partei³ | 29 | 0,18% | 0 | 0,00% |
| 20 | Gesundheitsforschung | 27 | 0,17% | 0 | 0,00% |
| 18 | DM | 12 | 0,08% | 0 | 0,00% |
| 15 | BGE | 10 | 0,06% | 0 | 0,00% |
| 13 | MLPD | 8 | 0,05% | 1 | 0,01% |
| 16 | DiB | 8 | 0,05% | 0 | 0,00% |
| 14 | BüSo | 3 | 0,02% | 1 | 0,01% |
| 17 | DKP | 2 | 0,01% | 0 | 0,00% |
- Stand: 27.09.2017 14:57:37