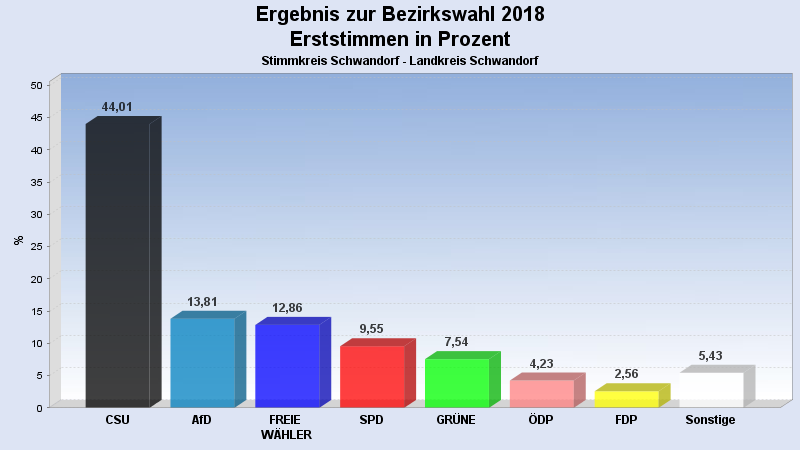
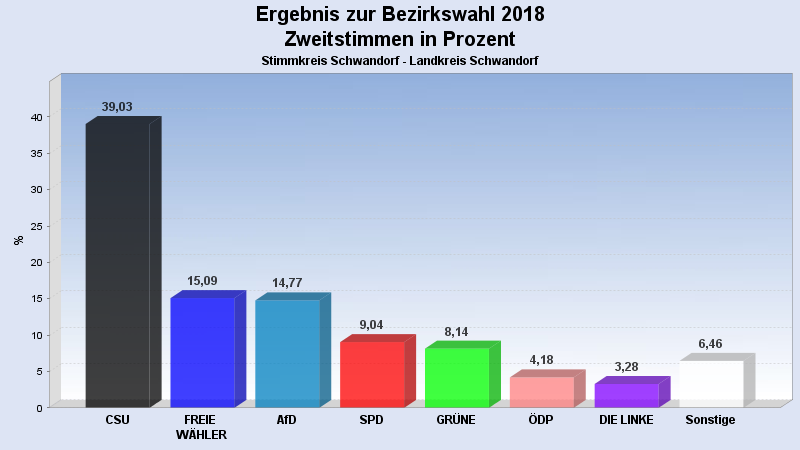
Ergebnis zur Bezirkswahl 2018 am 14.10.2018
Stimmkreis Schwandorf - Landkreis Schwandorf
Es wurden alle Stimmbezirke ausgewertet.
Wahlbeteiligung, Stimmzettel, Stimmen
| Wahlbeteiligung: | 71,31% |
|---|
| Stimmberechtigte: | 114.196 |
|---|
| Wähler: | 81.428 |
|---|
| |
| Ungültige Erststimmen: | 918 |
|---|
| Gültige Erststimmen: | 80.505 |
|---|
| Ungültige Zweitstimmen: | 1.169 |
|---|
| Gültige Zweitstimmen: | 80.252 |
|---|
 Seitenanfang
Erststimmen nach Wahlvorschlag
| WV-Nr |
Partei |
Erststimmen |
Prozent |
| 1 |
Ebeling, Thomas (CSU)
|
35.433 |
44,01% |
| 10 |
Kellermeier, Johann (AfD)
|
11.121 |
13,81% |
| 3 |
Tischler, Richard (FREIE WÄHLER)
|
10.354 |
12,86% |
| 2 |
Schärtl, Armin (SPD)
|
7.687 |
9,55% |
| 4 |
Juniec-Möller, Marion (GRÜNE)
|
6.072 |
7,54% |
| 8 |
Prey, Martin (ÖDP)
|
3.409 |
4,23% |
| 5 |
Lottner, Daniela (FDP)
|
2.058 |
2,56% |
| 6 |
Hundt, Sarah (DIE LINKE)
|
2.004 |
2,49% |
| 7 |
Eberhardt, Peter (BP)
|
1.859 |
2,31% |
| 9 |
Zimmerer, Marc (PIRATEN)
|
508 |
0,63% |
Zweitstimmen nach Wahlvorschlag
| WV-Nr |
Partei |
Zweitstimmen |
Prozent |
| 1 |
CSU |
31.325 |
39,03% |
| 3 |
FREIE WÄHLER |
12.114 |
15,09% |
| 10 |
AfD |
11.857 |
14,77% |
| 2 |
SPD |
7.252 |
9,04% |
| 4 |
GRÜNE |
6.532 |
8,14% |
| 8 |
ÖDP |
3.356 |
4,18% |
| 6 |
DIE LINKE |
2.633 |
3,28% |
| 7 |
BP |
2.168 |
2,70% |
| 5 |
FDP |
2.155 |
2,69% |
| 9 |
PIRATEN |
619 |
0,77% |
| 11 |
V-Partei³ |
241 |
0,30% |
- Stand: 17.10.2018 15:42:59
Seitenanfang
 Diagramm