Ergebnis zur Bezirkswahl 2018 am 14.10.2018
Stimmkreis Schwandorf - Landkreis Schwandorf - Gemeinde Stulln
 Diagramm
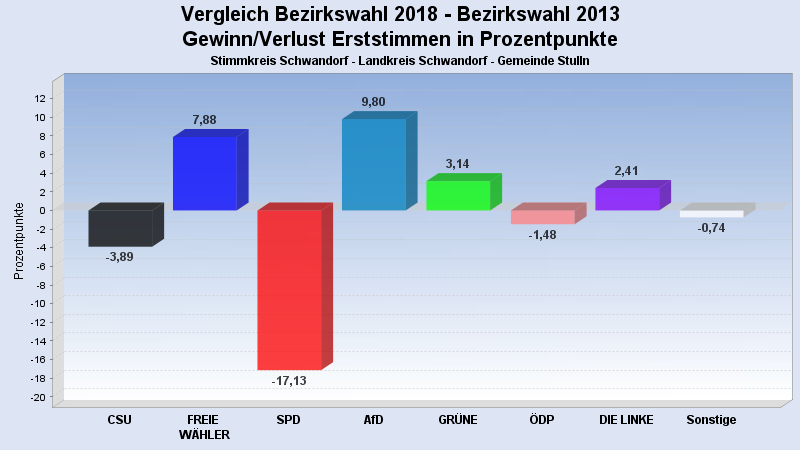
 Seitenanfang
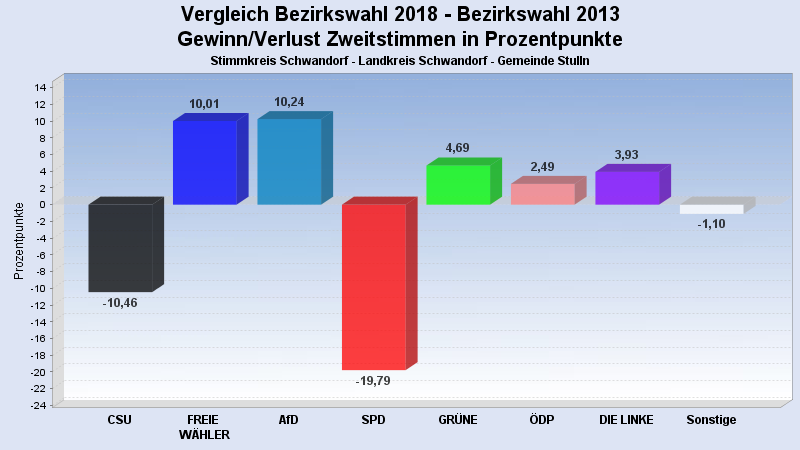
Wahlbeteiligung, Stimmzettel, Stimmen
| 2018 | 2013 | |
|---|---|---|
| Wahlbeteiligung: | 76,24% | 69,86% |
| Stimmberechtigte: | 1.334 | 1.327 |
| Wähler: | 1.017 | 927 |
| Ungültige Erststimmen: | 17 | 40 |
| Gültige Erststimmen: | 1.000 | 887 |
| Ungültige Zweitstimmen: | 11 | 9 |
| Gültige Zweitstimmen: | 1.006 | 918 |
Erststimmen nach Wahlvorschlag
| Partei | Erststimmen 2018 | Prozent 2018 | Erststimmen 2013 | Prozent 2013 | |
|---|---|---|---|---|---|
| 1 | CSU | 385 | 38,50% | 376 | 42,39% |
| 3 | FREIE WÄHLER | 169 | 16,90% | 80 | 9,02% |
| 2 | SPD | 123 | 12,30% | 261 | 29,43% |
| 10 | AfD | 98 | 9,80% | 0 | 0,00% |
| 4 | GRÜNE | 63 | 6,30% | 28 | 3,16% |
| 8 | ÖDP | 54 | 5,40% | 61 | 6,88% |
| 6 | DIE LINKE | 41 | 4,10% | 15 | 1,69% |
| 7 | BP | 32 | 3,20% | 24 | 2,71% |
| 5 | FDP | 27 | 2,70% | 7 | 0,79% |
| 9 | PIRATEN | 8 | 0,80% | 19 | 2,14% |
Zweitstimmen nach Wahlvorschlag
| Partei | Zweitstimmen 2018 | Prozent 2018 | Zweitstimmen 2013 | Prozent 2013 | |
|---|---|---|---|---|---|
| 1 | CSU | 355 | 35,29% | 420 | 45,75% |
| 3 | FREIE WÄHLER | 196 | 19,48% | 87 | 9,48% |
| 10 | AfD | 103 | 10,24% | 0 | 0,00% |
| 2 | SPD | 88 | 8,75% | 262 | 28,54% |
| 4 | GRÜNE | 79 | 7,85% | 29 | 3,16% |
| 8 | ÖDP | 59 | 5,86% | 31 | 3,38% |
| 6 | DIE LINKE | 56 | 5,57% | 15 | 1,63% |
| 7 | BP | 30 | 2,98% | 28 | 3,05% |
| 5 | FDP | 28 | 2,78% | 12 | 1,31% |
| 9 | PIRATEN | 8 | 0,80% | 22 | 2,40% |
| 11 | V-Partei³ | 4 | 0,40% | 0 | 0,00% |
- Stand: 17.10.2018 15:44:25